
How to calculate attendance percentage, and what the number hides
Somebody asks you for your attendance figure. It might be for a district report, a parent evening, or a slide the principal needs by Friday. You run the numbers, you get 94%, and the room relaxes a little, because 94 sounds like a good score.
The math is almost certainly right. The relaxing is the part worth questioning. An accurate attendance percentage can sit on a slide for an entire year while a handful of children in the building quietly fall a long way behind, and the number will never once look wrong.
This walks through how to calculate attendance percentage properly, including the two errors that quietly distort it in most schools, and then what the figure can’t tell you and which numbers to put next to it. At the end there’s an honest comparison of the ways schools actually track this, from a printed sheet through to a check-in app, including where each one stops working.

How to calculate attendance percentage
The formula is the easy part, and you almost certainly know it already:
Attendance percentage = (days present ÷ days enrolled) × 100
Take a student called Maya, enrolled for the full 180 day year, who attends 162 days. That’s 162 ÷ 180 = 0.9, or 90%. Hold on to Maya, because she illustrates the rest of this article rather well.
Everything else on this page is about what that 90% actually means, and why it deserves more scrutiny than it usually gets.
Two mistakes that quietly distort the number
Before getting to interpretation, it’s worth making sure the figure itself is sound. Two errors account for most of the attendance data I’ve seen that doesn’t hold up, and both are easy to miss because the output still looks perfectly reasonable.
Dividing by the wrong number of days
The denominator should be the days the student was enrolled, not the days the school was open. For most children those are the same figure, which is exactly why the distinction gets overlooked.
Consider a student who joins in November. The school year runs 180 days, but he was only enrolled for 112 of them, and he attends 106. His attendance is 106 ÷ 112, or 95%, which is excellent. Divide by 180 instead and you get 59%, which turns a child with near-perfect attendance into an intervention case.
This matters more than a rounding quibble, because of who it affects. Students who move mid-year come disproportionately from families in unstable housing, military families, and children in foster care. They are already the group most likely to be flagged, and a denominator error is one of the mechanisms that does the flagging. It’s worth checking how your system handles enrollment dates before trusting any list it produces.
Counting half days inconsistently
Most districts count a half day as 0.5. Some count any attendance over a threshold, often two hours, as a full day. Others count morning registration only. None of these approaches is wrong in itself.
The problem arises when two teachers in the same building apply different rules, which happens more often than anyone admits, because the rule usually lives in somebody’s memory rather than in writing. The result is that class-to-class comparisons become meaningless, and nobody realizes it. Pick whichever rule your state or district uses, write it down somewhere people can find it, and apply it everywhere.
Why 90% is worse than it sounds
With the calculation sound, the harder question is what the number communicates. And this is where attendance percentages do genuine damage, because we are all trained by every other figure in education to read 90% as good.
Maya is at 90%. In any other context that reads like an A minus, and if a parent heard it at a conference most would be quietly pleased. Said the other way round, Maya missed 18 days of school: three and a half weeks. If those days fell in one block she was gone from mid-February until nearly March. If they were scattered through the year, which is both more common and much harder to notice, she missed roughly one day a fortnight, every fortnight, all year.
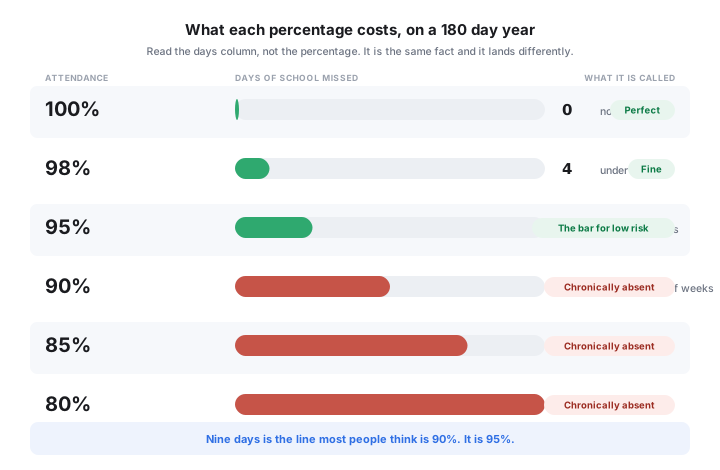
Whatever was taught in those 18 days, Maya doesn’t have it. Not learned it less well, but wasn’t in the room for it. The percentage is the only one of those two framings that sounds acceptable, and it’s the one that ends up on the slide.
Which leads to the most useful habit change on this page, and it costs nothing: when you say an attendance figure out loud, say the days alongside it. “She’s at 90%, so that’s eighteen days” produces a completely different response in a meeting to “she’s at 90%”, despite being the same sentence about the same child.
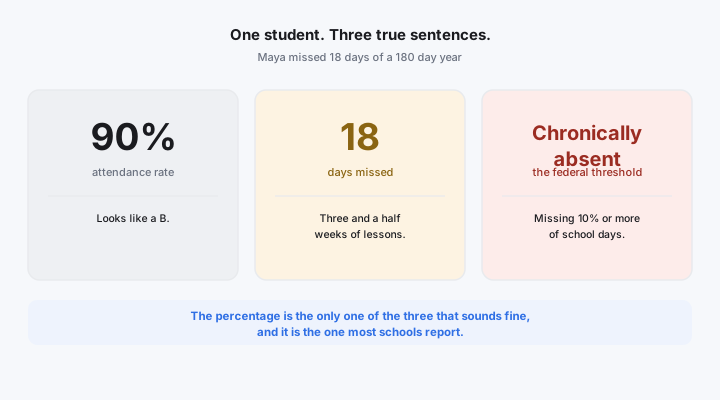
Attendance Works, whose research underpins most US state attendance policy, makes a related point about thresholds. A measure that treats everyone above 90% as acceptable, they note, “won’t distinguish between students who just met the measure, missing 17 days, and those who had much better attendance such as missing 5 days out of an entire school year.” Those are two very different children receiving the same label.
How to calculate it for a class or a school
The whole-school version of this figure is average daily attendance, usually shortened to ADA, and the formula scales the same way:
ADA = (total days attended by all students ÷ total days enrolled by all students) × 100
For a class of 25 across 180 days there are 4,500 possible student-days. If the class collectively attended 4,230 of them, ADA comes out at 4,230 ÷ 4,500, or 94%.
One trap is worth flagging here, because it catches people who are otherwise careful. You can’t average the individual student percentages to get this figure. Where students are enrolled for different lengths of time, averaging the averages weights a child enrolled for 40 days the same as one enrolled for 180, and produces a different and incorrect answer. Total the days first, then divide.
The problem with a school-level average
Even calculated correctly, a school-level attendance percentage has a structural weakness that’s worth understanding before you rely on one. Two schools can report an identical figure while being in entirely different situations, and the number gives you no way to tell them apart.
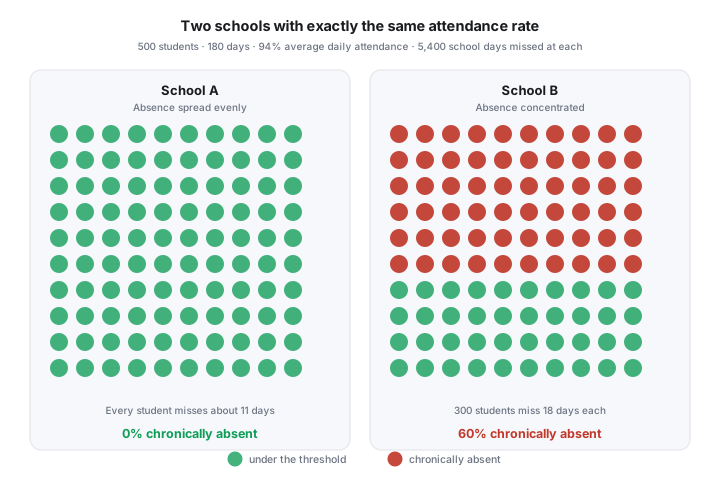
The arithmetic is worth walking through so you can check it rather than take my word for it. Take 500 students across a 180 day year, which gives 90,000 possible student-days. A 94% attendance rate means 6% were missed, and 6% of 90,000 is 5,400 student-days. Those 5,400 days have to land on somebody, and where they land changes everything.
Spread evenly across the school, every student misses about 10.8 days. Nobody crosses the 18 day line, and the school is genuinely in good shape. Concentrated, those same 5,400 days become 300 students missing 18 days apiece, which is 60% of the school, while 200 students with near-perfect attendance pull the average comfortably back up.
Both schools report 94%. The second has a serious problem it cannot see from its own headline figure, because the children with excellent attendance are mathematically covering for the ones without. That isn’t a quirk of the example, it’s simply how averages behave, and it’s the reason a school-level percentage should never be the only attendance number anyone looks at.
Chronic absence: the number that counts children
The measure that survives all of the above is chronic absence, defined as missing 10% or more of the days a student was enrolled, for any reason at all. On a 180 day year, that’s 18 days.
Two design choices make it work where an average fails. First, it counts children rather than days, so it can’t be diluted by students with good attendance; each child is either over the line or isn’t. Second, it deliberately ignores the excused and unexcused distinction, which feels harsh and is the right call. A child who missed twenty days with a doctor’s note has missed exactly the same teaching as one who missed twenty without. The note matters enormously for how you respond, and not at all for what was lost.
Attendance Works also puts low-risk students at 95% or more of days attended, and describes chronic absence as a proven early warning that children are off track for reading proficiently by the end of third grade. That 95% figure deserves a moment, because it means the real bar sits at nine missed days rather than eighteen, and very few schools set their internal target anywhere near there.
The three numbers worth reporting together
In practice, no single figure covers this, and reporting one in isolation is what creates the blind spot. These three together give a complete picture, and each answers something the other two can’t.
- Average daily attendance. Tells you how full the building is. Genuinely useful for funding, staffing and room planning, and useless for finding individual children.
- Chronic absence rate. Tells you what share of your students are over the line. This is the health of the school, and the number that actually moves when an intervention works.
- The list of names. Not a statistic at all, and the most valuable of the three by some distance.
The third is where anything changes. A rate tells you how large the problem is; a list tells you who to call on Thursday afternoon. In my experience the difference between a school that improves attendance and one that merely reports on it comes down almost entirely to whether somebody is making those calls, and whether they have a current list to make them from.
What to do with the list
Counting in days rather than percentages gives you natural intervention points, and they arrive well before anybody is formally in trouble:
- Around 5 days. Nothing formal at all. A friendly mention to the family, framed as noticing rather than warning. This resolves a surprising number of cases on its own, because a lot of early absence is logistics rather than reluctance.
- Around 9 days. Halfway to chronic, and the point to find out what’s actually going on. Transport, illness, anxiety, caring for a sibling and bullying all look identical in the data and have completely different answers.
- Around 14 days. A written plan agreed with the family, with something specific in it.
- 18 days. Chronically absent. At this stage you’re limiting damage rather than preventing it, which is precisely why the earlier steps matter more than this one.
How schools actually track this
None of the above requires software. What it requires is today’s number rather than June’s, and that’s where the method you choose starts to matter. Here are the four approaches I see most often, what each is good at, and the point at which each one stops working.
1. A printed sheet
Still the most common method in US classrooms, and for a single class it’s a perfectly good one. A printed roster on a clipboard costs nothing, works when the wifi doesn’t, and takes no training. Our free attendance sheet generator produces a print-ready month with only real weekdays and holidays already removed, and the seating chart tool does the same for teachers who take the roll by looking at the room.
Where it stops: the data is trapped on paper. Somebody has to transcribe it before any percentage exists, which means the figure is always days or weeks old, and nobody can answer a question about a specific child without finding the right sheet.

2. A spreadsheet template
The natural next step, and a big improvement, because the math maintains itself. The Excel attendance tracker template and the Google Sheets version both calculate present, absent and percentage as you tick each day, in weekly, monthly and yearly layouts, and both are free.
Where it stops: one spreadsheet per class. Producing a school-level figure means consolidating files by hand, and answering “who is at 15 days right now” means opening every one of them. In practice that means nobody asks.
3. Your student information system
Most districts already have one, and if yours reports chronic absence properly then you may not need anything else. It’s the system of record, it handles enrollment dates correctly, and it feeds state reporting.
Where it stops: SIS attendance is usually entered by teachers after the fact rather than captured as students arrive, so it inherits whatever inaccuracy the marking process has. It also tends to be built for compliance reporting rather than for a teacher who wants to see their own class today, which is why so many teachers keep a parallel spreadsheet.
4. A check-in app
The difference with this approach is that the mark is made at the moment the student arrives rather than transcribed afterwards, so the percentage becomes a by-product instead of a task.
OneTap is one option here, and it’s the one we build. Students check themselves in by tapping their name on a screen, scanning a code or entering a PIN, and the record is timestamped as it happens. Days present, days missed and percentage stay current per student and per class, any date range exports to Excel, and class attendance from every room rolls into one school figure without anybody consolidating files.
The part that’s relevant to this article specifically is that it holds a count per child rather than an average, so you can ask it directly for the students sitting at 15 days. That’s the list, available on a Thursday, while it can still change something. It’s free for up to 20 students, which covers a single class if you want to test whether having the number daily actually changes what you do with it.
Where it stops: it’s an attendance record rather than a student information system. It doesn’t hold grades or behavior data, and in most districts it sits alongside the SIS rather than replacing it.
Comparing the four
| Method | Cost | How current is the number | Can it give you the list of names |
|---|---|---|---|
| Printed sheet | Free | Whenever someone transcribes it | Not without reading every sheet |
| Spreadsheet template | Free | Current per class | Per class, yes. Per school, by hand |
| Student information system | Already paid for | As current as the marking process | Usually, if configured for it |
| Check-in app | Free tier, then paid | Live | Yes, on demand |

Choosing where to start
If you teach one class, start with a printed sheet or a spreadsheet template and don’t spend money. Both are linked above, both are free, and for a single roster they genuinely do the job.
The case for anything more arrives when the number needs to be current rather than accurate, and when it needs to cover more than one room. That’s usually the point at which a school discovers that the list of names, the most useful output of this whole exercise, is the one thing its current setup can’t produce on demand.
Whichever route you take, the habit matters more than the tooling. Convert your percentage into days, report chronic absence next to the average, and keep a list rather than a rate. Everything above works better once those three things are true.
Frequently asked questions
How do you calculate attendance percentage?
Divide the days the student was present by the days they were enrolled, then multiply by 100. A student present 162 of 180 enrolled days has 90% attendance. Use days enrolled rather than days in the school year, or students who joined or left mid-year will look far worse than they are.
What is a good attendance percentage?
Higher than most people assume. Research cited by Attendance Works puts low-risk students at 95% or more of days attended, which on a 180 day year means missing no more than nine days. 90% sounds respectable and means eighteen days gone.
How do you calculate average daily attendance for a school?
Total the days attended by all students, divide by the total days all students were enrolled, and multiply by 100. Don’t average the individual student percentages, which gives an incorrect answer whenever students are enrolled for different lengths of time.
What counts as chronic absence?
Missing 10% or more of enrolled school days for any reason, excused or unexcused, including suspensions. On a 180 day year that’s 18 days.
Should excused absences count?
For chronic absence, yes. The measure is about instructional time lost rather than whether the absence was permitted. The distinction matters a great deal for how you respond and not at all for what the child missed.
Is there a free attendance percentage calculator?
The Excel and Google Sheets templates linked above both calculate the percentage automatically as you mark each day, which is the same thing with the roll attached to it.
How do I calculate attendance for a student who joined mid-year?
Count only from their enrollment date: days present divided by days enrolled since they joined. Using the full school year as the denominator is the most common error in attendance reporting, and it lands hardest on the most mobile students.